5 Ways to Use Heat Maps to boost Retail sales conversions
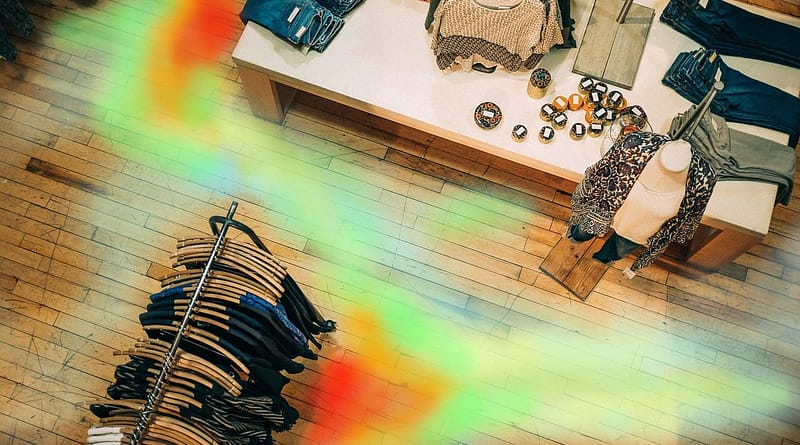
Heat map: a graphical visualisation of the most, and least, popular areas of a store. See immediately where most of your shoppers go and which areas they avoid. Heat maps provide invaluable insights into customer behaviour.
How to use the analytics generated by heat maps?
- Reveal
- Plan
- Experiment
- Measure
- Repeat
Use the understanding into where customers go most to plan and locate promotions in those areas. Sort out the dead zones – why is no-one going to these areas? Is it the merchandise, the signage. Is it a backwater outside the main route through the store? With the heat map knowledge retailers can experiment with different store layouts and campaigns and quantitatively measure the results. Easily compare the heat maps before and after and automatically calculate the effect on sales conversion and average transaction value.
Heat maps are a valuable addition to a retail analytics armoury of footfall figures, conversion, dwell times and average shopping times.
Store managers use the heat maps to decide where to place products. Will placing under-sold items in the busy areas boost their sales? Will moving items from the busiest areas to the dead zones draw more people to move around the store? With heat maps and live sales conversion figures retailers can quickly see how their new layout is working.
Retailers can also improve the customer experience by locating staff in the busy areas. The busy spots might also need to be allocated additional cleaning.
Managers are often surprised when they see their store’s first heat maps by how much of it is infrequently visited. Using the heat map allows them to optimise their layout and fix the dead zone problems. It takes the guess work out of decisions.
How it’s done
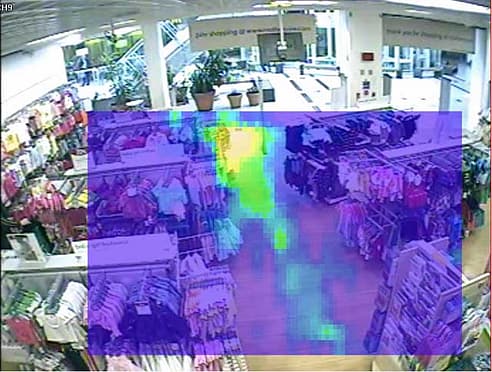
Using images from in-store cameras, people-detection software tracks shoppers through a store and records their paths – accurately analysing the video content. Nobody is personally identified, preserving people’s privacy.
Heat maps are generated showing popular areas graphically. These comprise colours overlaying an overhead picture of the store, with the most intense colours showing where most people went.
5 Ways to Use Heat Maps to Improve Store Performance
- Measure impact of promotional displays
- Improve customer service in busy areas
- Remove dead zones
- Effectively place products
- Use in conjunction with sales conversion and average transaction value measures to increase profits
Thanks for sharing this informative article.
Heat map analysis is a graphical visualization of the utmost, and slightest, crowded areas of a store. See instantly where most of your purchasers go and which areas they avoid. Heat maps offer invaluable insights into customer behaviour.