


Smart Retail Sensing
How to use smart retail sensing to enhance business profits: increase conversion ratio, improve average transaction value and maximise number of items per transaction.
What can be done to increase the business potential of each person entering a store? How to make efficient use of the huge amount of data available and vast know-how, achieving a 30% rise in sales in just a few months? Contact us or read on.
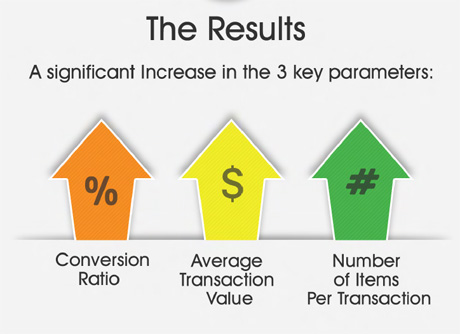
Optimising for just three parameters can dramatically increase sales.
- Raise conversion ratio
- Raise the average transaction value
- Raise the average number of items per transaction
- Continue the improvement over time
How to Achieve these Retail Excellence Aims
Combine technology and expertise in retail management with the five stages model.

The 5 stages to achieve retail excellence
- Data Collection
- Analysis
- Planning retail adjustments - adjusting a customised tool box
- Act
- Back to Data Collection to monitor, measure and make more improvements to the key performance indicators
The Retail Toolbox
There are various retail analytics tools which can be used to increase sales and optimise the retail process. These include...
Tool: Average shopping or dwell time
The average shopping time reflects the overall level of service in the store. The better the service, the longer people stay and the more likely they are to make a purchase. Measuring and improving average shopping time results in an increase in:
- The number of people buying something
- The number of items they buy
- The amount of money that they spend

This chart shows some very different average shopping times in a chain of shops in Germany. In the shops where people spend just 6 minutes there is great potential for improvement and increased sales.
Tool: Queue Monitoring
Nobody likes queuing. Too long a queue annoys customers, drives them away and makes it less likely that they will return another day. Measuring queues - knowing exactly how many people are in the queue at the moment, the average queuing time, how many people leave the queue before reaching the front and so on - allows retailers take steps to remedy any problems found. The tool can also predict when queues are likely to form and enable retailers to take pre-emptive action.
Tool: Conversion Rate
Integrating people counts with the point-of-sale system allows staff to see the current conversion rate of the store - down to 5 minute intervals. They can immediately take action to improve performance.
Time Table
collection
Big Data
The footfall counts and other information can be integrated into big data sets, sending real-time data to "brokers". The brokers process the data and make it available to authorised end users via cloud reporting.
Impact of Retail Analytics and Business Intelligence
An increase of 30% in sales is achievable in just a few months, without any increase in store traffic. Contact us for more information. Fill in the form below, call +44 (0)161 839 6437 or email sales@retailsensing.com
Find out More
Download as a pdf file  or as a slide-show.